
Fish in the Bay – 21-22 July 2018 UC Davis Trawls – Eight years of Trawling.
Hi everyone. A summary of UC Davis trawl results from Saturday, July 21st.

Bad News: I was visiting my daughter and son-in-law in Virginia, so I missed the July trawls. Jim Hobbs did his best to supply some photos, but given the demands of driving a boat, sorting the catches, and documenting the data, photo quality and quantity suffer a little. Face it: the Hobbs Lab fish monitoring in San Francisco Bay and Delta is a shoestring operation – three people in a boat to assess environmental status of most of the swimming critters in the Bay. It’s all we got unless someone else rides along. On months when I participate, I do what I can to add value through photos.
Good News: Jim Hobbs noted that this is now the eighth year of fish surveys in Lower South Bay. He started the monitoring in mid-2010 as an effort to document fish species for the South Bay Salt Pond Restoration Project. The first few years of monitoring were a little infrequent and random. I tend to think of 2013 or 2014 as the years when fish surveys really started showing impactful data. Hobbs is now close to documenting fish over a full ENSO/PDO cycle, however that may be defined. We now have specific, albeit often incomplete, knowledge regarding spawning, recruiting, feeding, competition, and climate-induced variability for roughly 30 species of native and invasive fishes and their interaction with at least a dozen other important invertebrates like mysids, corophium, and Bay shrimp. Not bad for a shoestring operation held together by dedicated researchers. With species going extinct all over the globe, even in our own Delta, it strikes me as incredibly important that we continue to understand and manage what happens in our local fish nursery.
Saturday, 21 July – Bay-side trawls

Sunday, 22 July – upstream and east of Railroad Bridge

Another reminder: I was not the photographer on this trip!

Norm Ponferrada and Jim Hobbs photo bombing Pond A19 on Sunday. For July, Jim Hobbs and Emily were joined by Norm Ponferrada and his friend Jaekob Borges. Norm worked with Jim in the early years of South Bay monitoring – 2010 to 2011.

Emily Trites, Jim Hobbs, and Jaekob counting fish and bugs caught in Artesian Slough.

Anchovy count was about right for July = 187 total from trawls. Expect to see anchovy numbers increase through November unless early and abundant rains knock them down. Photo above: Jim Hobbs shows off a classic resident Brown-back anchovy (top) versus a larger ocean-going Green-back.
Yellowfin goby numbers thankfully dropped off considerably since the June “flash mob” attack. But, notice that most of the 1422 fish caught on Saturday were counted as 1000 “unidentified gobies.” We should assume that many, if not most, of the tiny unidentified gobies were larval yellowfins. The 2018 springtime baby-fish bonanza was random. In previous years, April or May have been baby-fish months. I did not expect large numbers of baby fish as late as July. But, with only a few years of data, there could be baby fish variability we have yet to understand. … And, we must understand this!

Crangon continue to compete well with Palaemon shrimp on the Alviso side, albeit they are almost extirpated further up Lower Coyote Creek. (Photo above: A tub full of Crangon shrimp.)
The excel data tables confuse this month’s shrimp story. I originally structured the tables around how trawls are performed on Saturdays and Sundays. For better or worse, I listed “island pond” stations A19 and A21 in the middle columns. This is geographically correct, but not an optimal order in terms of habitat-type for some bottom-dwelling critters. Bottom-dwellers that seek deep water or creek and tidal velocity avoid shallow ponds. It took me a few years of playing with excel data to realize that young Starry Flounder, for example, prefer the main channel of Lower Coyote Creek over ponds. I believe the same is true for English Sole. Similarly, Hobbs’ lab has thoroughly documented that leopard sharks avoid the ponds due to warmth and dissolved oxygen depletion. For slightly different reasons, invasive corbula clams also avoid ponds and tend to plant themselves in the mainstem of creeks near the base of the “salt wedge” where creek borne food tends to deposit. (http://omp.gso.uri.edu/ompweb/doee/science/descript/saltwedg.htm ). On the other hand, anchovies, herring, and most of the gobids (native and non-native) apparently prefer the pond habitat.
Shrimp gradient. With all that in mind, here is a simplified Shrimp & Corbula table showing July results in a more sensible Coyote Creek station order – from Bay to upstream. For example, Crangon were most numerous far downstream near Coy4 with numbers dwindling at each further upstream station.


Palaemon shrimp numbers peaked in the vicinity of station Coy2. (Photo above shows a pile of clear-bodied palaemon and synidotea.)
Exopalaemon shrimp are hanging out even further upstream at UCoy2. Exopalaemons caught there may be part of the larger population supported in freshwaters of Dump Slough.
Corbula clams. A big pile of Corbula (aka: Amur River clams) were collected at UCoy2 station – 889 clams! This is one of our typical corbula hotspots. Corbula are superbly adapted to out-compete native species for food and habitat, but their range in Lower Coyote Creek appears to be very narrow. Someday, we will have to deal with these pesky mollusks. I have a hunch that mollusk management would not be as hard as it looks: Corbula tend to pile up near locations where Hobbs and crew typically measure the most extreme “salt wedge” effects, e.g. differences between top and bottom temperature, salinity, and dissolved oxygen. It makes hydraulic sense for this clam to plant itself there. Incoming tide slams into, and slides under, seaward flowing creek water. Turbulence and rapid drop in water velocity at Alviso, Artesian and UCoy2 locations cause organic food material to deposit, creating corbula sweet-spots. Knowing where and why corbula concentrate could make it relatively easy to control the populations, should we ever decide to do so.

Another bad surprise: Philine snails. This is an ongoing disaster. Small piles of non-native, worthless, and disgusting philine (“snotball”) snails were collected at the two stations in the middle of Lower South Bay. All I read about this gastropod invader from New Zealand says that it’s only function in life is to kill and consume bivalves and other mollusks we like.
Mollusk management – a kooky idea: Philines probably don’t tolerate pulses of freshwater too well. For that reason, philinis do not co-exist with Corbula in Lower Coyote Creek. Could corbula populations be controlled by simply “air-dropping” live philinis onto corbua hotspots?? If all went well, the philinis would hopefully eat corbula, then simply die with winter flushing! NOTE WELL: I do not recommend this experiment unless or until additional studies showed that 1) philinis will actually eat corbula, and 2) philinis would actually die out over time at stations Alv3, Art3, and UCoy2. Personally, of the two mollusks, I like philinis least.
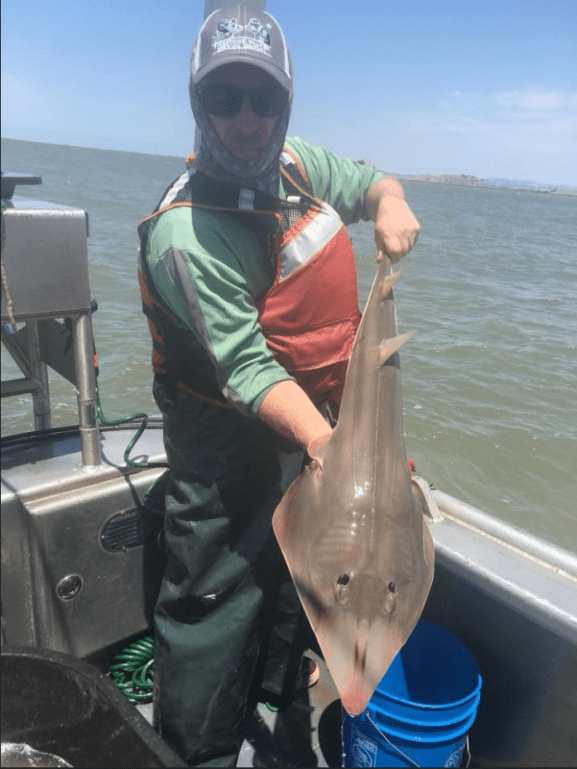
Guitarfish. I believe this is the third Shovelnose Guitarfish caught by Jim Hobbs in eight years of trawling. The other two were much smaller and younger and prior to the early 2017 freshwater flush that caused a brief shark and ray die-off. A bat ray and leopard shark were also caught at this station. This is nice confirmation that sharks and rays are still doing OK.
The guitarfish is one of my favorites: half-ray and half-shark. See the two giant holes just behind his tiny eyes?? I mean the holes on the guitarfish, not Jim Hobbs! The holes on the guitarfish are spiracles (breathing holes). Sharks, and particularly rays, use spiracles instead of the mouth to take in water for respiration. For rays, spiracles are essential because their mouths are on the bottom of the fish against the mud. But, the freaky thing is that the holes in Jim Hobb’s head behind his eyes (AKA: his ears – not visible in this photo) are evolutionarily directly descended from spiracles of our fish ancestors that were repurposed for hearing around 400 million years ago! https://phys.org/news/2014-01-evidence-animals-evolved-ability-air.html Truth is stranger than fiction.

Bat Ray. A total of four bat rays and two leopard sharks were netted in July. This young bat ray is being held up to show some of his white underside. Notice that Jim is holding the bat ray by gripping its conveniently located spiracles, again just behind the eyes. This is the correct bat ray handling method. This slippery fish has a stinger on the tail. You must keep all body parts well away from that tail.

Topsmelt. Five topsmelt were caught over the weekend, but that is a lot for trawling. These small fish tend to stay near the shorelines and in marshes where trawl nets can’t catch them. I believe it has been over a year since we last saw a topsmelt from trawls, and they were always much smaller than this one. Beach seine nets in Alviso marshes usually catch at least a few though. Several years ago, Jim Hobbs reported 13 topsmelt caught in otter trawls between January and June 2012. http://www.southbayrestoration.org/documents/technical/Hobbs_South%20Bay%20Salt%20Pond%20Restoration_Jan-June%202012_Summary.pdf
Topsmelt can grow larger than this 6-incher caught at station Coy1, shown above. But, she is among the larger ones caught here thus far. The bigger surprise was that she was heavily pregnant – full of eggs. Topsmelt spawn in these marshes, and it is nice to occasionally get solid confirmation like this. More topsmelt info here: http://www.elkhornslough.org/sloughlife/fish/topsmelt.htm

Longjaw Mudsucker. This is another of our favorite fish and a sentinel species indicating healthy pickleweed marsh must be nearby. Five were caught in July, compared to one caught in June and three earlier in February. This particular mudsucker is a male. He has the prominent long jaw that gives him his name. See how the jawbone extends back to the operculum (gill cover)? The long jaw is thought to be used as a mating display. Like topsmelt, mudsuckers tend to stay near the shoreline and in shallow marshes (like pond A19) where they are less likely to be caught by otter trawls.
Jim Hobbs authored a short paper discussing mudsuckers as native indicators of local climate change for the Baylands Ecosystem Habitat Goals Science Update (BEHGU – 2015) that is available here: https://baylandsgoals.org/wp-content/uploads/2015/10/BEHGU_5.1_CaseStudy_LongjawMudsucker.pdf

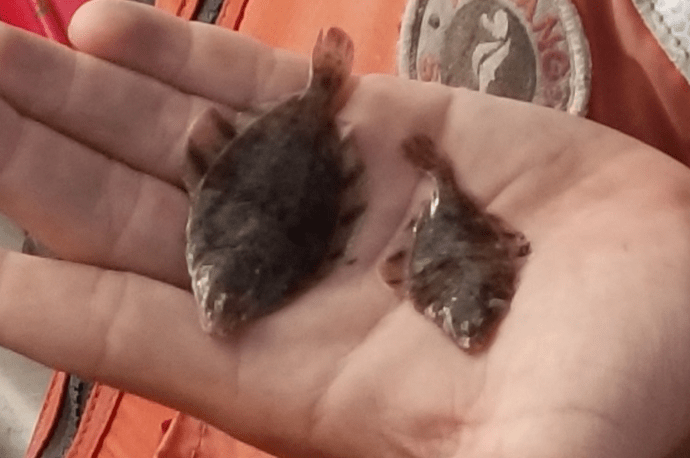
Three-spined Stickleback. This is another fish that likes the ponds, at least this weekend. This photo highlights the 22+ bony plates on its sides. Bony plates and spines (spines not shown in this photo) are the stickleback defense system in saltwater habitats.
As mentioned in earlier posts, plates and spines are a great defense against large-mouthed predators found in saltwater habitats. However, they are a very bad defense system against freshwater insect predators like dragonfly nymphs. Natural selection causes stickleback populations to quickly lose some plates and spines in freshwater within just a few decades. This suggests that sticklebacks could be tracked as an indicator of long-term habitat change from salt marsh to fresh or vice-versa: just count the plates and spines.

Starry Flounder. This was one of 29 starrys caught in July. With luck, we should see more of these over the next few months. Young starrys show up in the main stems of the lower creeks and sloughs as summer progresses, albeit seven of these 29 were caught in the ponds.
Two more starrys caught further up Coyote Creek. These are more of the babies that shelter and feed in the lower parts of Bay creeks. They will generally move further out toward the sea as they grow depending on food availability.

Staghorn Sculpin numbers continue to drop. Only 19 caught in July. We saw dozens of plump adults in late 2017 through February 2018. Babies first showed up in March. Then almost 1400 babies were caught and released in April. I totally expected we would be seeing hundreds, if not thousands, of Staghorn teenagers by now. What happened? Where did they go? We have eight years of experience showing that staghorns come and go, but we have little clear idea what causes this.

American Shad (top) with Threadfin Shad (below). Shad numbers also continue to drop. Only three of these caught in July. We now know that freshwater from winter rains greatly stimulate shad recruitment. Shad went from rare catches to some of our most numerous fish soon after the 2017 February Flush. Now it appears that the more typical Bay salinity and freshwater deprivation is catching up with them.

Jaekob Borges showing off a Striped Bass from Coyote Creek. We learned last year from experience (seeing dead bass in July 2017) and Peter Moyle’s book that Striped Bass can start dying of heat stress at 25 degrees C. Bay and Creek water temperatures reached that threshold in July. I have not yet heard any reports of dead bass this summer, and the four caught this weekend appeared to be healthy.

Arrow Goby numbers are up for a second month. (Note: Arrow Gobies shown above were from the June weekend.) More good news is that higher than usual numbers of Arrow Gobies continue to be caught. This is one of the tiny native gobies that likely competes with, and gets eaten by, much larger non-native yellowfin gobies. Like many other changes, we have no idea why 2018 is the Summer of the Arrow Goby. My two years of Arrow Goby notes missed some months, but the table below shows that June and July Arrow Goby catches were extraordinary, albeit only a small fraction of Yellowfin Goby numbers. I had suspected that the near dearth of Yellowfin Gobies from December 2017 thru May 2018 allowed Arrow populations to recover.

But, as you can see from the table above, the data is still too patchy to make a firm conclusion. Goby numbers peak around summer, and this is a particularly good year for Arrow Gobies. I can’t say much more than that.
* I added Shokihaze, Shimofuri, and Unidentified gobies to the matrix at the last minute for a more complete analysis. I did not include Chameleon, Cheekspot, or Bay gobies which were very rarely encountered. I apologize for missing months of data. This is just an initial SWAG at describing Lower South Bay goby populations in comparison to Yellowfins.

Jim Hobbs preparing to deploy the otter trawl net. Jim usually handles the acrobatic work of managing the nets. As you can see, there is little time or attention given to photographing fish unless someone else works the camera.

Jaekob taking a Secchi reading. For those unfamiliar, Secchi depth (in centimeters or inches) is a crude but effective standard measurement of water turbidity from the surface. A 20 or 30-centimeter white disk, first conceived by Angelo Secchi in 1865, is lowered into the water on the shady side of the boat until it disappears from view. https://en.wikipedia.org/wiki/Secchi_disk
Surface turbidity usually ranges from one to two feet in Alviso Marsh Complex. Much of the turbidity is due to dense phytoplankton near the surface though there is also a considerable amount of silty suspended sediment in this shallow marsh area. Counterintuitively, many types of fish greatly prefer turbid water over clear. What we describe as “dirty water” a fish thinks of as “safe water,” where predatory birds and fish are less likely to attack; or perhaps “food-packed” water where filter feeding bugs and fish can fuel up. Either way, this soupy brownish-green marsh water is what fish like.

Some people like it too.
That’s all for now folks.
 Previous Post
 Next Post