
Fish in the Bay – 15-16 September 2018 UC Davis Trawls – Cycling the Carbon.
As happened earlier in July, I again missed the boat in September. The UC Davis crew performed their trawls on the weekend that my wife and I left for three-week vacation in Italy. I will do my best to piece together a story based on data and fish photos that Jim Hobbs forwarded to me.

The trawling stations.

As usual, Pat Crain drove the boat. Jim Hobbs managed nets and counted fish.

Emily Trites collected water quality data and recorded fish numbers.
Saturday, 15 September – Bay-side trawls

Sunday, 16 September – upstream and east of Railroad Bridge

I am still wrestling with best way to display readings of DO, Salinity and Temperature for each station – microscopic font size is a poor solution. If there is a strong indication of salt-wedge, I show top/bottom readings from either start “s” or end “e” of the trawl. This is confusing and a little arbitrary, but it is hard to ignore Dissolved Oxygen varying from 3.9 mg/l at bottom to 6.1 at top at Station Coy1 for example.
Think about this: if we were pelagic fish, we would quickly learn how to dart down a few feet into oxygen-deprived depths to swallow struggling or lethargic bugs on the bottom. It would be fairly easy to return to the top for “a breath of air,” so to speak. I am pretty sure some types of fish have figured this out.

Crangon and Bat Rays in one tub. This was the catch from Station Coy2 or Coy3. We can see at least two bat rays (one “belly up”) amongst the thousands of crangon shrimp.
Bat rays eat crustaceans. They are specifically noted for eating shrimp and crabs. Twelve of 17 bat rays were caught at stations with over 1,000 shrimp this weekend. Are we looking at a bat ray buffet here?

Crangon. Over 9,000 crangon were caught in September. Until recently, I would have raved about what an extraordinary catch this was. But, you may recall that almost 18,000 crangon were caught in August. 9.000 crangon no longer shocks me. 2018 continues to be a record-year for Crangon based on 8 years of Hobbs’ trawl data. Does this indicate that the Bay is healing? Or is this simply a fluke?

Shrimp gradient tables. This unprecedented Crangon-summer inspired me to extend and modify the shrimp tables I started two months ago. The tables show May through September distribution of three shrimp-types: Palaemon, Crangon, and Exopalaemon, along with Corbula Clams.
- I switched the placement of Crangon and Exopalaemon as I started to realize that Palaemon and Crangon shrimp favor the same habitat range in Lower Coyote Creek out to Lower South Bay.
- Similarly, Exopalaemon shrimp and Corbula clams are more restricted to upstream / fresher Alviso Slough and UCoy stations. Station UCoy2 has been a particular sweet-spot for both Corbula and Exopalaemon shrimp this summer.
- Between columns Coy4 and Coy3 in tables above, the slender blue column indicates where Alviso Slough (Station Alv3) flows into Lower Coyote Creek. Palaemon and Crangon counts at Alv3 roughly track with numbers at Coy4 and Coy3, indicating that all three stations are within a boundary where crangon like to hang out.
- Shrimp are key links in this healthy estuarine environment. We must understand our shrimp!
- Corbula are nuisance invasive pests. We must understand them too; then kill them!

Bat Ray. Two views of a bat ray from Station LSB2.

Leopard Shark. Only one young leopard shark was caught. This photo gives you a good sense of the roughness of the shark’s skin. Every time I pick one up, I get surprised that the shark is not smooth and slippery like other fish. It feels exactly like coarse sandpaper (80-grit or coarser).

Anchovies and some Red Algae at Coy2. Unfortunately, without a dedicated photographer (me), only 5 or 6 anchovies were photographed this weekend. I am very hopeful that we will soon fully and rigorously describe our San Francisco Bay resident “Brown-back” anchovy sub-species as compared against the ocean migrant population “Green-backs” and “Blue-backs.”
These five fish, collected at Coy2, have a strong “Brown-back” appearance. They also look young, less than a year old, to my untrained eye.
Also, a new form of red algae was present. We see red algae on occasion, but this type has finer hair-like filaments. Field notes indicate the red algae was seen at Stations Coy2 and Coy4. (I know practically nothing about red algae except that it is almost always a good food for fish.)

Corbula. Thankfully, corbula numbers dropped off a bit from July and August.

Corbula Table. I made the above table to better assess how corbula populations seem to be moving around. Until this year, I had not noticed specific corbula sweet-spots, but I had not been paying attention either. I only started recording corbula numbers in late 2017, so I don’t yet know what typical seasonal distributions should look like. Station UCoy2 continues to be a significant sweet-spot, but only since June. Alviso Slough stations also host large, but variable, numbers of corbula.
- I presume corbula recruit and concentrate at places where a combination of river flow and tides provide best food and salinity characteristics.
- Jan Thompson has also reminded me on various occasions that one good flock of winter diving ducks can clean out a corbula bed over a weekend.
- At some point, I will have to mine older Hobbs data to get to the bottom of this mollusk-world mystery.

American Shad. Only 16 American Shad and no Threadfin Shad were caught.
We continue to close the arc of the 2017 shad story: Prior to late-2017, either species of shad were rare one-offs. In September 2017, 134 American Shad were netted along with 17 Threadfins. From that point on, the two shad species became some of our more common catches. Recruitment of both types was boosted by the unusually wet winter rains of early 2017. Now they are getting scarce again as Lower South Bay dries out.
- September 2018 data shows that several American Shad were around 95 mm in length and several were close to 195 mm. These are likely two different cohorts: one hatched in winter 2017, then a demographic echo in winter 2018.
- Both species of shad are non-native, so we may not really care about shad. But, on the other hand, this data is a strong indicator that we can modify this ecosystem to attain outcomes we desire: 1) Choose which species you like, 2) then add or subtract river flushing water at the right time of year. Easy as pie!

White Sturgeon. This is our second sturgeon for 2018. The other was caught in March. This big fish would normally be expected to out-swim the net, but Dissolved Oxygen at 3.9 mg/l at the bottom of Station Coy1 may have slowed it down.
This sturgeon was just over 6 feet long (1830 mm). There is a 40 to 60 inches “slot limit” for sturgeon caught in California: if the sturgeon is shorter than 40 inches or longer than 60 (5 feet) nose to fork, it must be released. That means this Coyote Creek grandpa, or grandma, sturgeon is SAFE – too big to ever take home, assuming no one cheats. (Also note that slot limits can change year-to-year depending on sturgeon population assessments.)

White Sturgeon in North Bay too! Micah Bisson with Alyssa Alfonso with sturgeon from one of the Napa-Sonoma trawls a few days later. Alyssa’s expression in the left-side photo says it all: “OMG! Are you getting this on film?!?!?!” Photo on right: Micah with his new sturgeon friend.
Sturgeon eat shrimp, possibly more than anything else, albeit ghost shrimp and mud shrimp are more typically listed as dietary mainstays. I have read various times that eels and lampreys can be the preferred sturgeon food when available.
This article from 2014 recites some interesting sturgeon history: California sturgeon were almost wiped-out from over-fishing by 1917. https://www.recordnet.com/article/20140101/a_sports03/401010306
Personally, I am not a vegetarian nor inclined to exclude meat from my diet. But, when I see a fish like either one of these two, I can’t imagine how anyone could kill or eat such an amazing ancient 200-million-year-old dinosaur fish.

Longjaw Mudsucker – profile view. This was one of only three mudsuckers caught in September. In these photos, he is making use of his special mouth-breathing ability – filling his buccal cavity with air when out of water. Photos at different angles seem to show that he is a very well fed mudsucker.
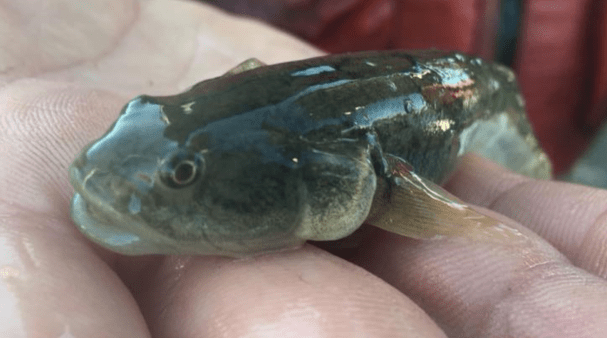
Longjaw Mudsucker – front view. He should be hunkered down in a pickleweed patch. Being caught out in the deep channel may indicate that this guy was the loser in a fight for a prime nesting site. Or maybe, he was on his way back for round 2 when he got caught.

Starry Flounder. 62 starrys caught this weekend, and this is the time when young starrys should be showing up. A few were of reproductive size.

Starry Flounder with tubercles. Though still small, the sandpapery skin texture of this starry indicates that it is ready for reproduction. (Also note, the two starrys featured in these photos have eyes on different sides of head.)

Striped Bass. These are two of only three striped bass caught on the weekend. Always with mixed feelings: striped bass are a great game fish native to the Atlantic Coast. And, they are also a voracious non-native predator here. Are striped bass a good or bad thing?
Striped Bass are good? I found a fascinating short article about Dr. Livingston Stone risked his life to successfully introduce Striped Bass to California in 1879: https://www.arkansasstripers.com/striped-bass-stocked-in-pacific-ocean.htm
Striped Bass are not so good: When I attended a day of the Bay-Delta Science Conference on 11 September, I watched a presentation, by Matt Nobriga from USFWS, titled: “Is it … possible that Striped Bass had Long Been a Fundamental Limit on Delta Smelt Population Growth?”
Matt made a compelling case that spread of striped bass populations in Northern California Delta and river systems alone explain a century of decline and endangerment of Delta Smelt. Matt strongly acknowledged that Delta Smelt have also endured other profound stressors, to include habitat loss, freshwater flow declines, warming rivers, competition with other non-native species, etc. But, his takeaway was that there were enough striped bass in Delta and rivers by the 1930s to account for Delta Smelt population crash, notwithstanding all other ecological factors.
Matt’s final point was a good one: We think of the Delta Smelt as a fragile fish. But, given all the catastrophic stressors, the smelt has proven to be a shockingly hardy survivor … up to now!

Marsh restoration. Just another Pond update: two shots of the “Island Ponds” showing status of restored marshes in September. Both ponds were breached in March 2006 – just 12 years ago! Until that time, both totaled about 400 acres of hyper-saline wasteland.
- Pond A21 continues to be a dense spartina marsh ringed with borrow ditch moat.
- Pond A19 is mostly a mudflat sprinkled with large stands of spartina and pickleweed.
- Both ponds host large populations of dowitchers, dunlin, curlews, avocets and other marsh birds in summer with additional flocks of dabbling and diving ducks, and coots in winter.
- Both ponds are now carbon sequestering and cycling machines.
Bonus section – Why I like tiny bugs.

Carbon cycling. This has been my “go-to” carbon cycling model since around 2016. The major take-away is the big critters we see, the beautiful fish and birds, are not really very important. All the important stuff happens at the microbial-level.
(Yes, I shamelessly ripped images off the internet – most notably, the cartoon copepod at top is Stephen Hillenburg’s “Plankton” from SpongeBob Squarepants. Someday I may have to ask permission, or substitute my own cartoon. BTW: Hillenburg studied marine biology at Humboldt State and recently gifted the university $135,000 to further marine research: https://krcrtv.com/north-coast-news/eureka-local-news/spongebob-squarepants-creator-gifts-hsu-135000-toward-marine-research )
Anyway, the slide is my attempt to merge diagrams of the “Microbial Loop” and “Classic Food Chain” into one colorful schematic showing how most of the world’s carbon is cycled and sequestered in the marine environment.
- Bacteria decompose and resurrect carbon, nitrogen, and oxygen endlessly from the Carbon Pool via the “Microbial Loop.”
- Protozoans and phytoplankton graze carbon and energy off the microbes.
- Copepods are the main multi-cellular lifeforms that harvest energy from both the “Classic Food Chain” (phytoplankton) and off the top of Microbial Loop.
- I heard once that the biomass of all copepods on earth is about 10 times the biomass of all animals larger than a copepod! (Possibly not quite that big: I need to find a citation.)
- Hence, all larger lifeforms on Earth (fish, birds, and us) directly or indirectly depend on the mighty copepod (or other similar tiny arthropods) bust carbon out of the microbial loop.
Last week, I gave a talk about research and environmental policy to an 8th grade class at invitation from Kip Gordon and his daughter Isabel. God help me! … I actually attempted to explain the microbial loop and carbon cycling at a middle school!
 (Image from Roland Birke / Getty Images: https://www.thesprucepets.com/culturing-amphipods-and-copepods-2924613 )
Good News: The 8th graders were engaged and peppered me with questions. Several of them had heard of copepods before. But, I got gasps from the audience when I explained that “Plankton” from SpongeBob was actually a copepod with a single red eye, as shown in the image above … the most important bug on Earth. This blew their minds, and that’s a good thing.

Microbes in marsh Soil. Sometimes I take photos of interesting looking mud and pond scum, like this one from the August trawls.
- See how the mushy brown layer overlies black anaerobic mud? The mushy brown layer is almost certainly composed of living and dead phytoplankton and bacteria slowly decomposing in a normally anoxic (oxygen-depleted) zone.
- The lower black layer is characterized by anaerobic (no-oxygen) “Sulfur-Reducing Bacteria” (SRBs) that give off the hydrogen-sulfide “rotten-egg” smell. This is the zone where microbes specifically cycle sulfates, phosphates, and other compounds. The black layer is also where mercury is methylated when mercury is present. https://en.wikipedia.org/wiki/Sulfur-reducing_bacteria
- Dense stands of bulrush root themselves in this decayed mass, pulling carbon and nitrogen from the soil and carbon dioxide from the air.
- Isn’t that amazing? We are witnessing carbon cycling right before our eyes! I could sit there and watch that mud all day long.
Until next time.
 Previous Post
 Next Post